
InterRent at a Glance
InterRent (TSX:IIP.UN) is a multi-family residential real estate investment trust dedicated to owning, managing, and developing homes for more than 13,000 Canadian households, operating in four core regions – Greater Toronto & Hamilton Area, Greater Montreal Area, National Capital Region, and the Greater Vancouver Area.
As of December 31, 2024, our portfolio is comprised of 123 communities with a total of 13,435 suites. We leverage our platform to support a high-performing team to drive growth and create long-term value for all stakeholders.

(1) Represents 11,368 suites fully owned by the REIT, 1,462 suites owned 50% by the REIT, and 605 suites owned 10% by the REIT.
A Word From Our CEO
Dear Fellow Unitholders,
Strong operating and financial performance
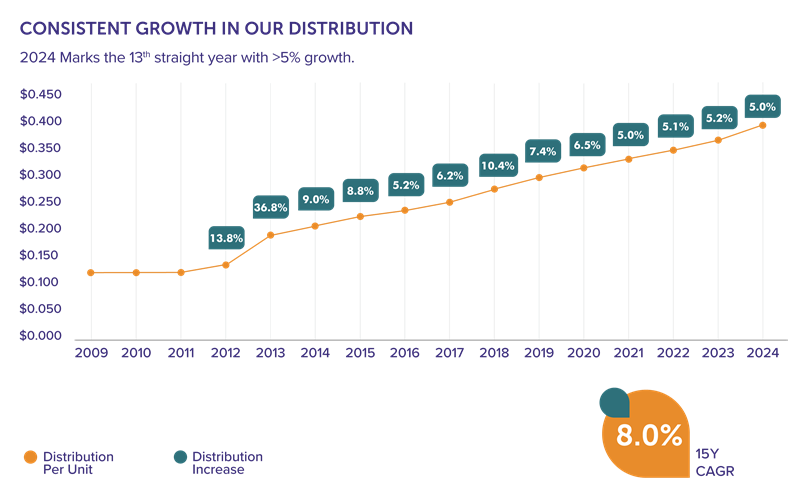
Through it all, the quality of our portfolio, its stability and resilience were clearly demonstrated once again throughout the year. Continued rent growth, coupled with stable and rising occupancy, collectively drove a strong 9.4% increase in 2024 same-property NOI. By improving our borrowing profile and reducing our variable rate debt, and benefiting from a more stabilized interest rate environment, we achieved a meaningful reduction in financing costs, translating top-line gains into a strong 12.6% increase in FFO. This strong performance has allowed us to be able to increase our distribution by 5% or more for the 13th consecutive year.Moving forward with more active capital recycling
In 2024, we have strategically advanced our capital recycling program, disposing four communities at or above their IFRS values, supporting the valuation of our portfolio while generating $93.3 million in net proceeds after accounting for closing costs and mortgage discharges. Our disposition strategy is a very deliberate process, focusing on properties where we have successfully achieved our value-add objectives. These assets had strong performance, but did not have the same growth profiles compared to the rest of the InterRent portfolio.Conviction in our high-quality portfolio
Our conviction in the strength of our portfolio is built upon two factors:Prioritizing and advancing on sustainability
In 2024, we continued to make progress on our sustainability priorities, focusing on balancing meaningful impact with cost-effectiveness. One of the key initiatives was our formal Double Materiality Assessment, which helps us meet new reporting requirements, prioritize the right sustainability initiatives, and better manage risks and opportunities to drive long-term value.The year ahead
We are looking ahead to 2025 with cautious optimism. While we face many uncertainties, we remain confident that the longstanding, systemic nature of Canada’s housing shortage will always support demand for our well-located, high-quality communities for our residents.2024 Highlights
We are pleased to report another year of solid financial results, posting four quarters of strong growth in our same property portfolio, consistent NOI margin expansion, and delivering exceptional value to our unitholders.
Same Property Proportionate NOI

YoY SP Proportionate NOI Growth

Same Property NOI Margin
+140 YoY Growth

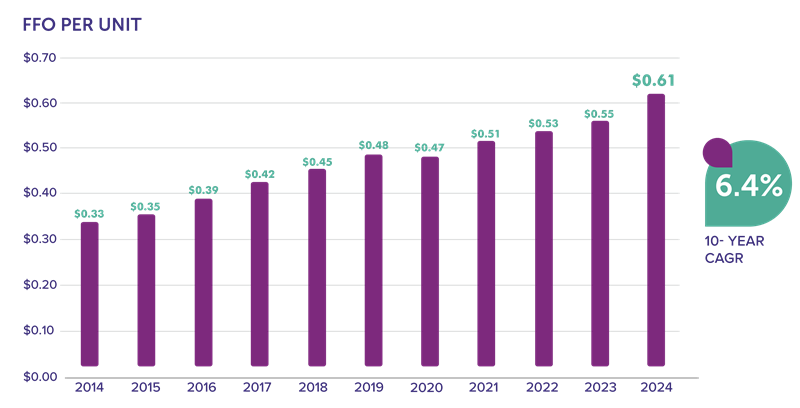
YoY FFO per Unit Growth
Delivered $0.612 FFO per Unit

Occupancy (December)

Distribution Increase

Available Liquidity
February 14, 2025

YoY AFFO per Unit Growth
Delivered $0.543 AFFO per Unit

2024 Milestones

Building Value with a High-Quality Portfolio
Conviction in our High-Quality Portfolio
Our portfolio is strategically concentrated in four of Canada’s largest and fastest growing cities: the Greater Toronto and Hamilton area (GTHA), Ottawa, Montreal and Vancouver. These core markets are at the heart of Canada’s economic activity, with stable population growth, strong and diverse employment demand, and structural housing supply constraints, which underpin long-term, sustainable and resilient rental demand and support the most compelling opportunities for value creation.
Within each of these core markets, we leverage our deep local knowledge and economies of scale to achieve operating synergies. This strategic positioning enhances our ability to deliver strong performance, efficient operations and exceptional resident experiences.
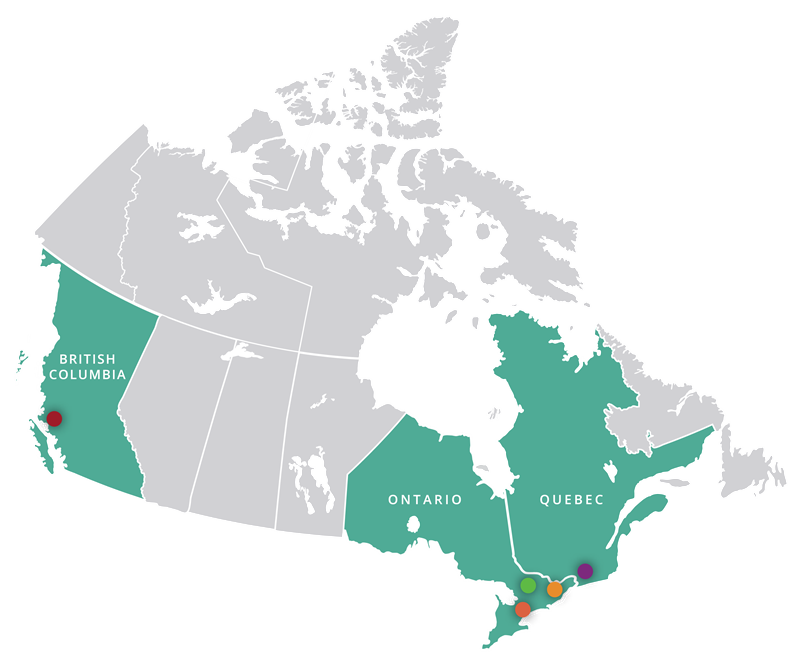
NOI by Region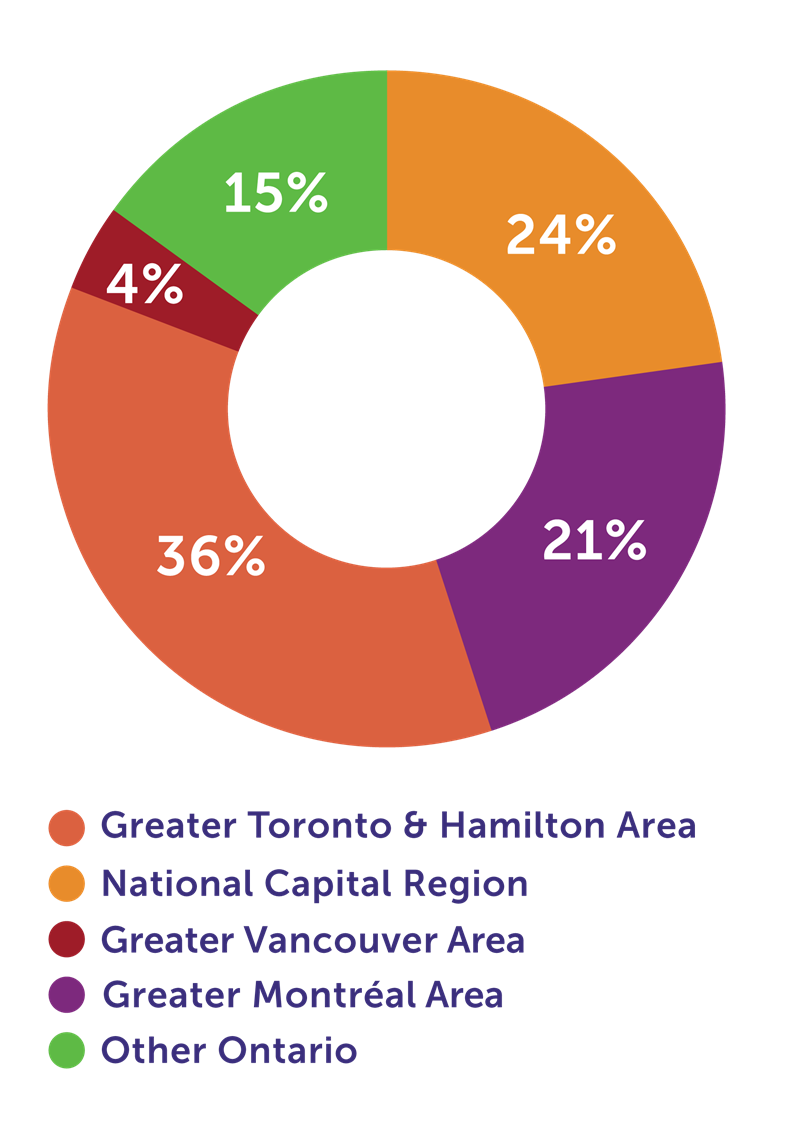
High-Quality Assets in Premium Locations
In each of our urban core markets, we own some of the best-located communities. Our communities are strategically located near transit hubs, established universities, tech hubs and hospitals, which are key drivers of rental demand. This strategy allows us to attract strong residents, secure premium rents and maintain industry-leading turnover rates.
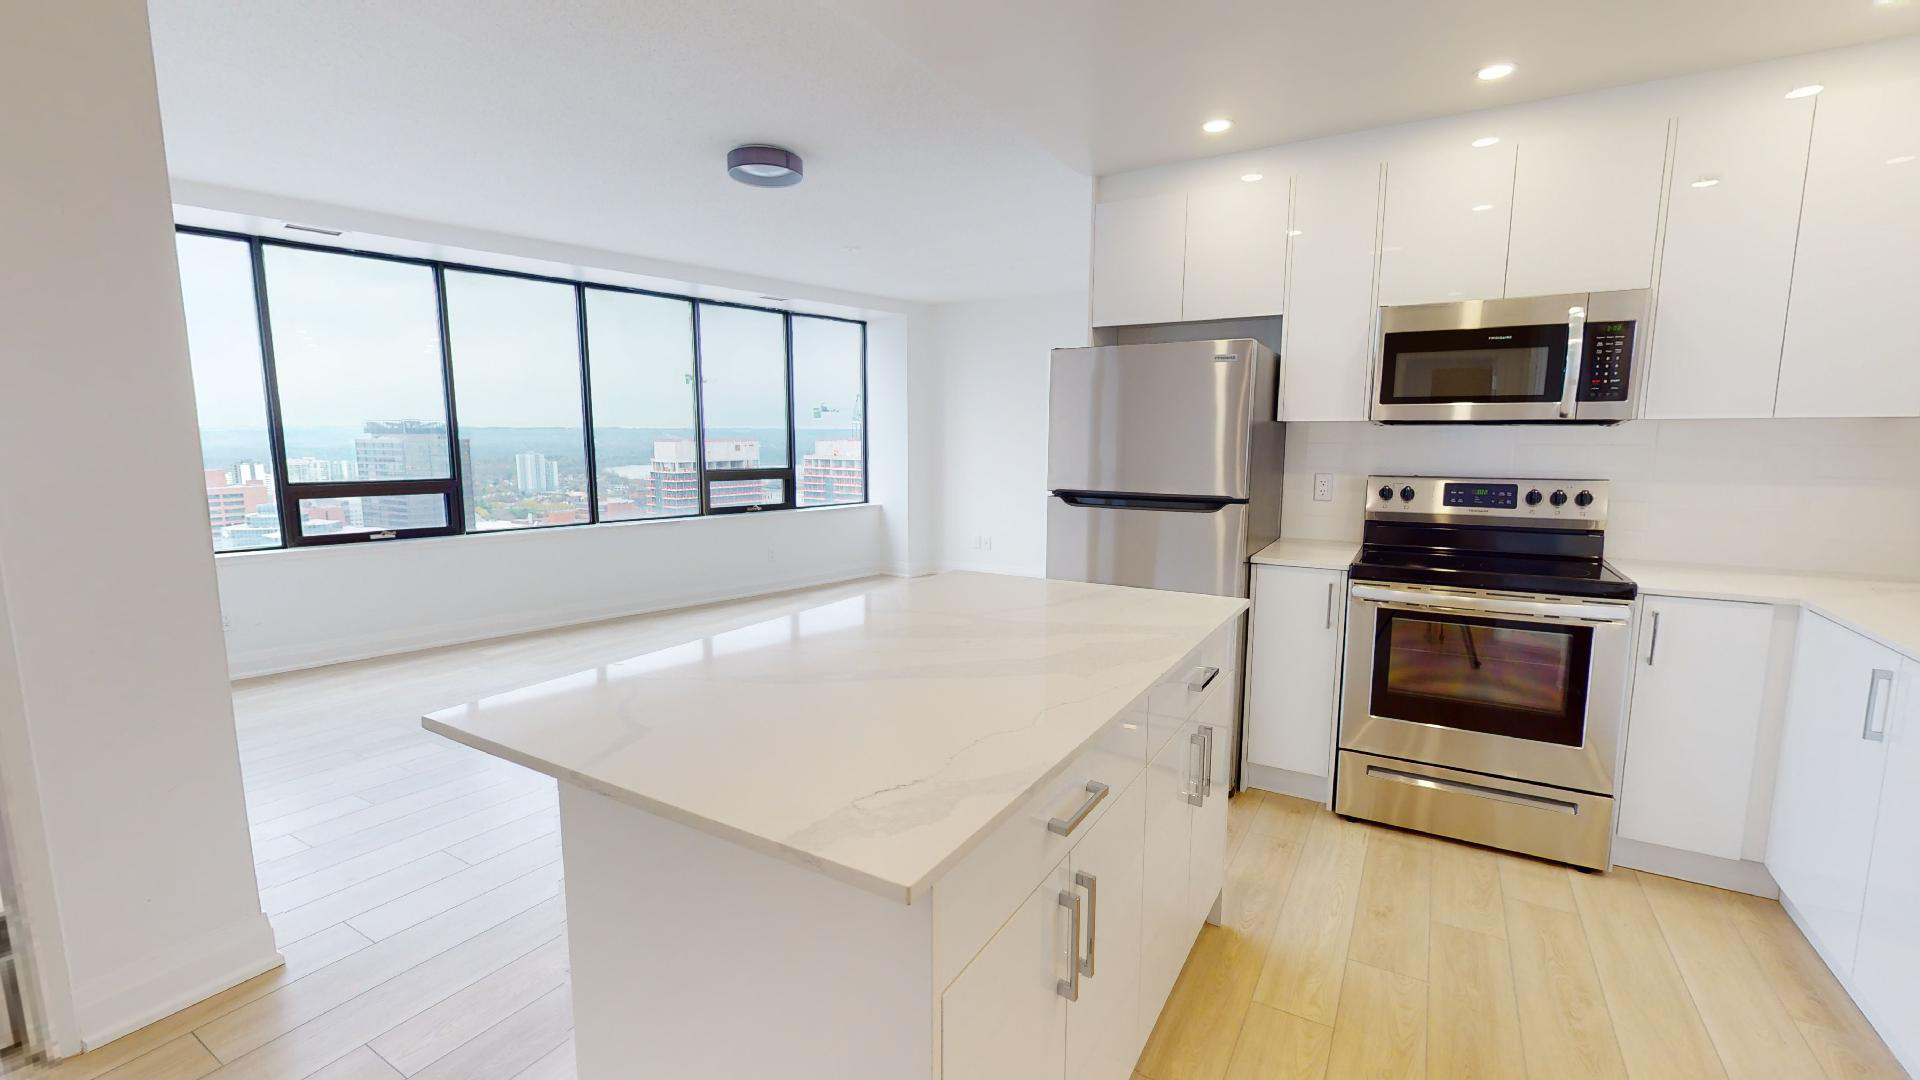
We consistently optimize our portfolio through our active repositioning program. Over the years, we have invested strategically in a variety of improvements, including amenities, building systems, security and energy efficiency. These efforts are designed to future-proof our communities, ensuring that our portfolio remains in top condition to drive resident satisfaction and strong financial performance.
Well Maintained & High Quality Assets

90%
As of January 1, 2025, 90% of our portfolio has been repositioned with modernized amenities and building systems.

23 years
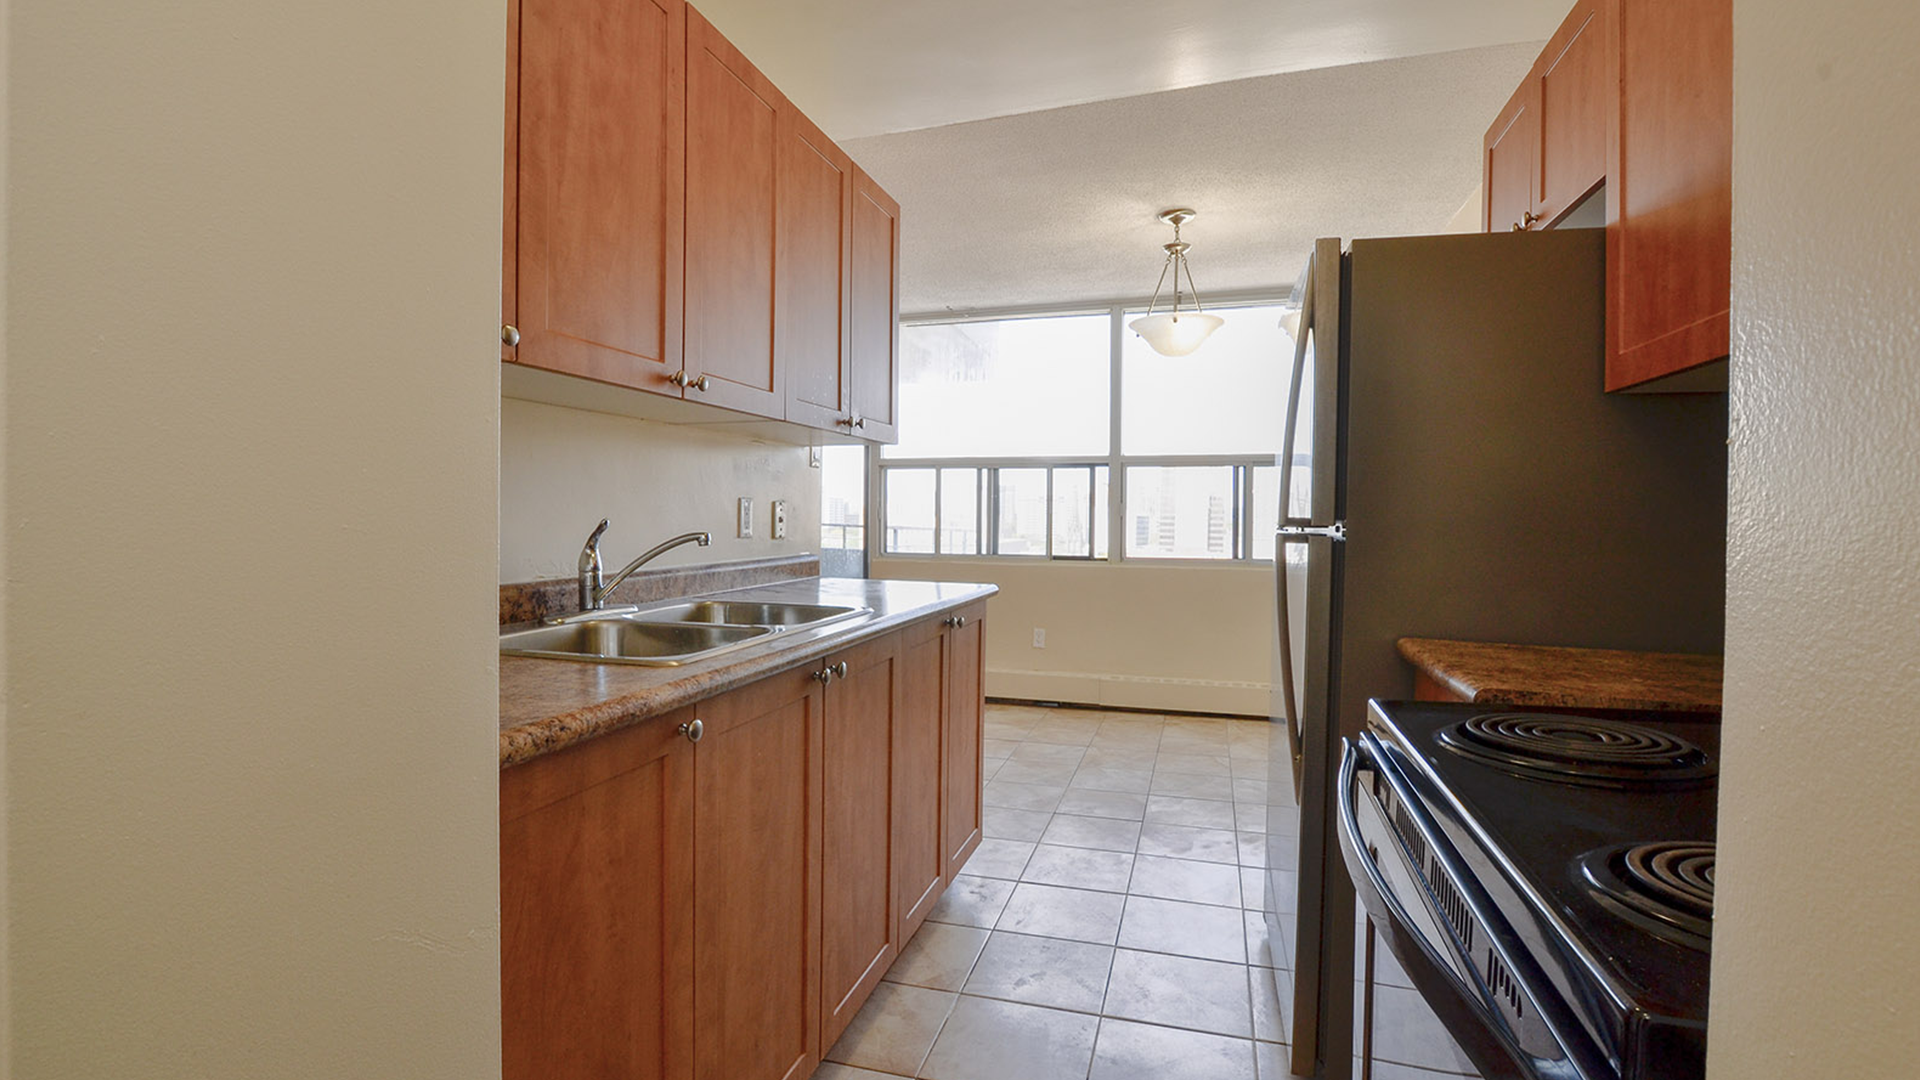
Our non-repositioned portfolio is relatively young, with a weighted average age of just 23 years.
Premium Urban Locations

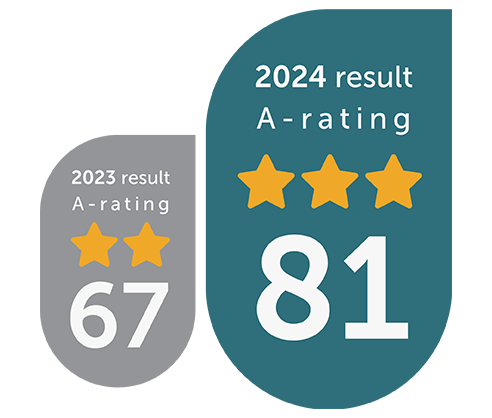
81
As of January 1, 2025, our portfolio has an average Walk Score of 81, the second highest level achievable. It is considered ‘Very Walkable”, where most errands can be accomplished on foot.

39%
More than one third of our communities boast a Walk Score of 90 or more, the highest level achievable. It is classified as “Walker’s Paradise”, where daily errands do not require a car.
Our Core Markets in Premium Locations
GREATER TORONTO & HAMILTON AREA (GTA)

NATIONAL CAPITAL REGION (NCR)

GREATER VANCOUVER AREA (GVA)

GREATER MONTREAL AREA (GMA)

Building Value with Our Operating Platform
We work to build long-term value by leveraging our operating platform to drive efficiency and enhance property performance. Our approach includes transforming communities through physical repositioning, optimizing the use of space, and enhancing resident experience and connections through technology.
Physical Repositioning
Our team has a proven track record of creating value through the repositioning of rental properties. This process involves targeted investments in property improvements, including upgrades to amenities, infrastructure, in-suite appliances and fixtures, and energy efficiency measures. These strategic investments are calculated to meet return thresholds by reducing operating costs, increasing occupancy and maximizing rental income, and improving the quality of our portfolio over time. Physical repositioning will continue to be a strong driver of value creation, supported by the experience and expertise of our operating platform.
Intensification
Some of our communities have available land or space suitable for intensification opportunities within existing buildings, or the potential for new apartment buildings. We actively assess these investments as they allow us to add suites without incurring additional land costs, while considering local demand and returns thresholds. Over the past 2 years, we have added 48 suites through intensification within current buildings.
We believe these opportunities, which are separate from our existing development pipeline, could create up to 1,000 net new suites.
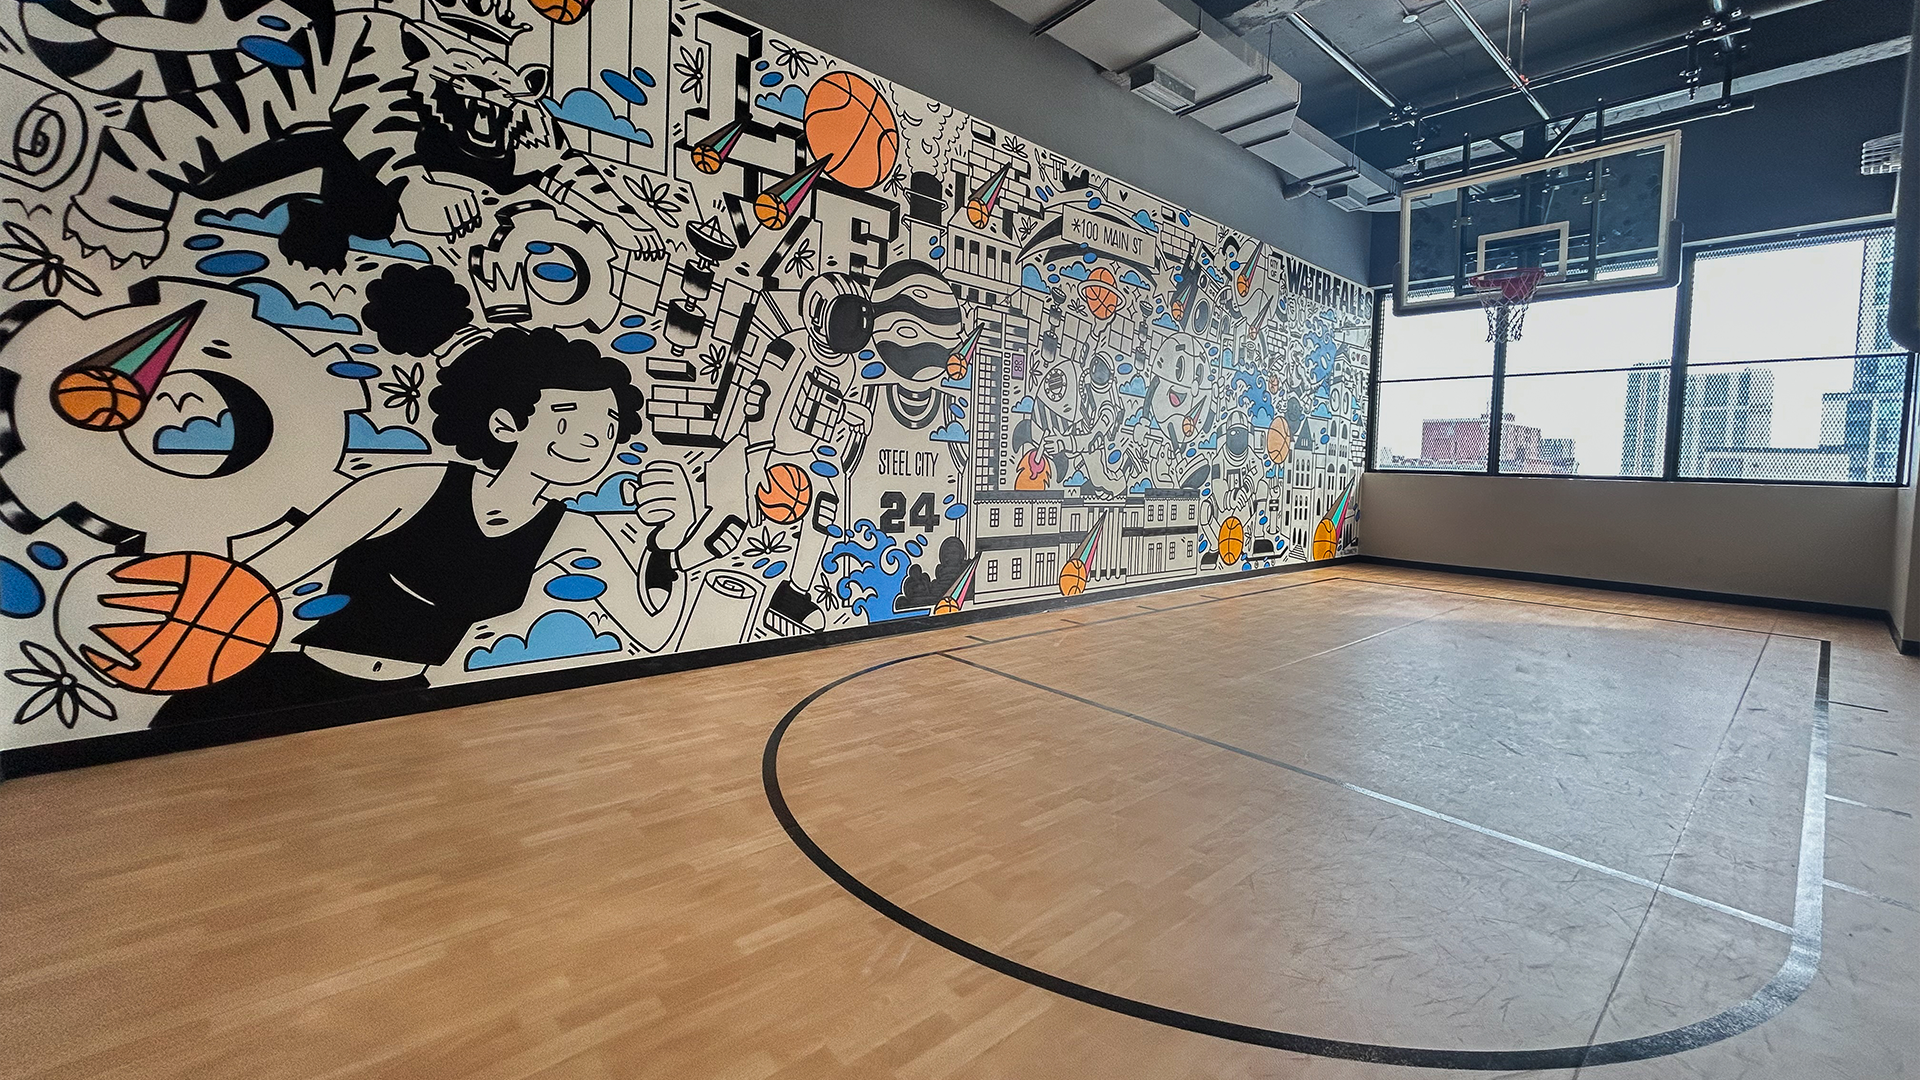
Case Study: 100 Main

COMMUNITY AMENITIES
- Community room
- Fitness centre
- Sky lounge on 45th floor
- Indoor basketball court
- Yoga studio
 CITY: HAMILTON
 REGION: GTHA
 ACQUISITION YEAR: 2020
 SUITES: 295
 COMMERCIAL UNITS: 29
 PURCHASE PRICE: $76M

Technology
Innovation and technology play a significant role in our operating strategy. We invest in and adopt technology to enhance our business insight and operating efficiency, enhance experience and connection with our residents, and reduce costs. By streamlining processes, we free up time for our team members to focus on higher value-add activities and deliver more personalized service to our residents.
Enhance Resident Experience
A key focus for 2024 has been deepening engagement and communication with our residents. By further integrating our CRM system with the resident portal, we’ve streamlined interactions, making it easier for residents to connect with us. This integration allows for a more seamless resident experience, ensuring that all communications, from service requests and inquiries to general feedback, are tracked efficiently and addressed in a timely manner. Currently, 85.4% of our residents are signed up for the resident portal, where they can easily submit work orders, check rent balances, and make rent payments.

Smart Spending on Suite Turns
We employ a strategic, data-driven approach to suite turn management, leveraging a cutting-edge mobile centric software solution to enhance cost control and maximize returns. This technology enables comprehensive analysis of projected revenue outcomes, empowering us to make informed, data-backed decisions. By streamlining approval workflows and optimizing resource allocation, we effectively reduce vacancy durations, enhance operational efficiency, and drive overall portfolio performance.

Building Value with Our Culture
Our corporate culture is our competitive advantage, with our values forming the foundations we build upon.


Meet the Team


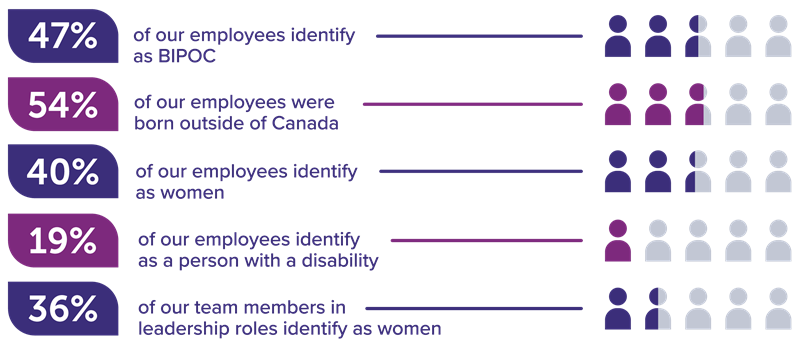
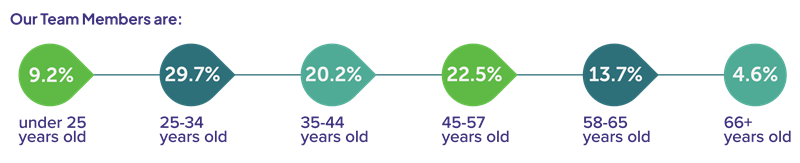
Diversity of Thought and Experience Drives Innovation
Our workforce is diverse and reflects the communities we serve, helping us better connect and respond to the needs of our residents.

Measuring Our Progress
In 2023, we introduced a refreshed brand identity and renewed our commitment to both our internal customers, our team members, and our external customers, our residents. As we continue to advance our culture, we measure our progress through a number of key metrics:
Internal Customers: Our Team Members
We gauge our team’s engagement and satisfaction through our Annual Talent Survey, monitoring participation rates and feedback to celebrate successes and identify areas for improvement.
External Customers: Our Residents
We assess resident satisfaction through our Annual Resident Experience Survey, tracking engagement rates, Net Promoter Scores, and online reviews to ensure we are meeting and exceeding expectations.


Building Value with Our Sustainable Mindset
We continue to make smart and intentional progress on our sustainability priorities, focusing on projects that enhance resilience, reduce emissions and operating costs, and create long-term value for our stakeholders.
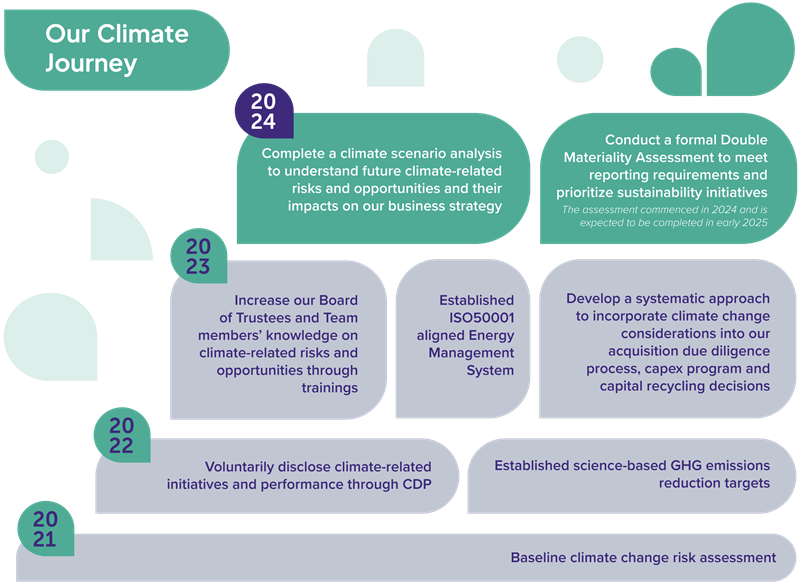
The results of our Double Materiality Assessment will inform our key sustainability priorities for the years ahead. Learn more about our sustainability commitment in our 2024 Sustainability Report, set for release this spring.
GRESB Real Estate Assesment
We continued to participate in the GRESB Real Estate Assessment and achieved a 21% year-over-year improvement in our 2024 GRESB score and were ranked first among Canadian public multi-family REITs.

24th Mike McCann Charity Golf Tournament
Our commitment to giving back to our communities continued to grow in 2024. The 2024 Mike McCann Charity Golf Tournament set a record by raising $1,802,000, bringing our grand total to nearly $10 million since its inception. This achievement was made possible by the incredible generosity of our many sponsors and the dedication of our team members. The proceeds are given to a variety of local charities within the communities where we operate.
Charities we Support ¹
(1) The list is not exhaustive
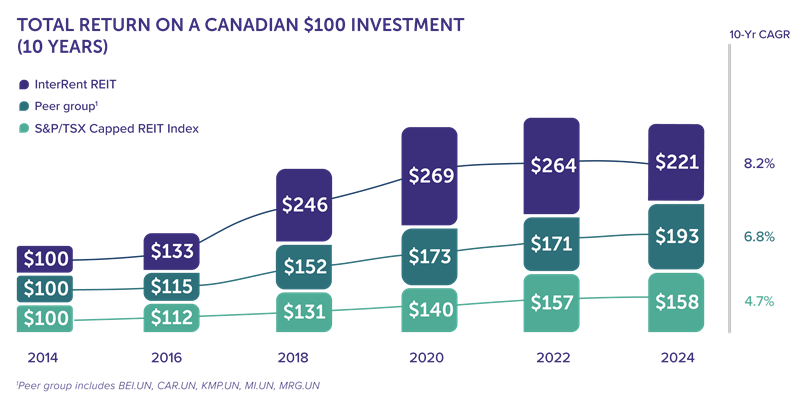
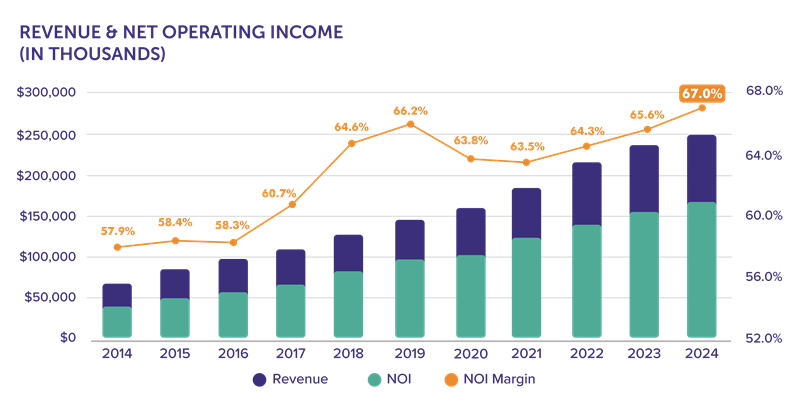
Our Track Record
Driven by our operating platform, our top performing team, and technology, we have consistently delivered strong performance metrics.
Investor Information
InterRent REIT is listed on the Toronto stock exchange.
Ticker symbol: TSX:IIP.UN
Investor Relations
Renee Wei - Director of Investor Relations & Sustainability
renee.wei@irent.com
Tel: 289-952-2218
www.irent.com/en/investors
Transfer Agent
TSX Trust Company
200 University Avenue, Suite 300
Toronto ON, M5H 4H1
Tel: (416) 342-1091
Fax: (416) 361-0470
Email: tsxtis@tmx.com
Website: www.tsxtrust.com